Insights from graphs

9. Fiscal Balance Shifts After COVID-19: Insights from Korea (2011-2024) and France (2005-2024) (Aug–Sep, 2025)

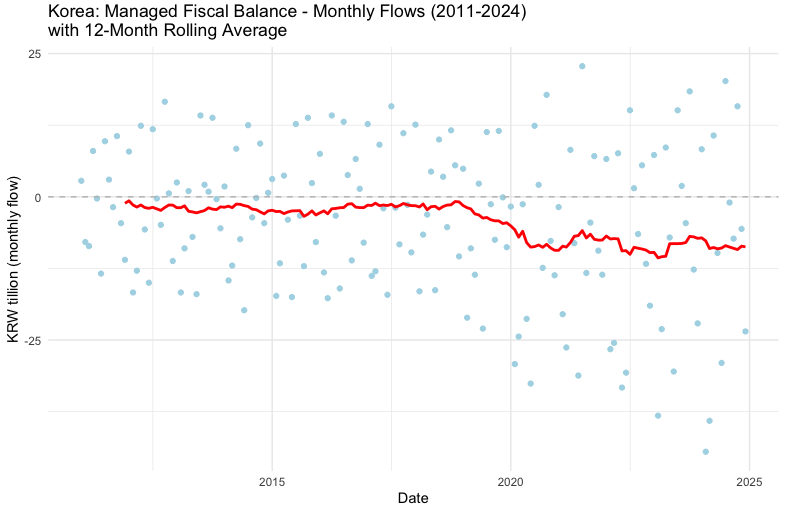
Managed fiscal balance in Korea, 2011-2024

source : 열린재정 (data: 2011-2024, monthly)

The managed fiscal balance experienced increased dispersion following COVID-19 and has remained tilted to the downside until recently.

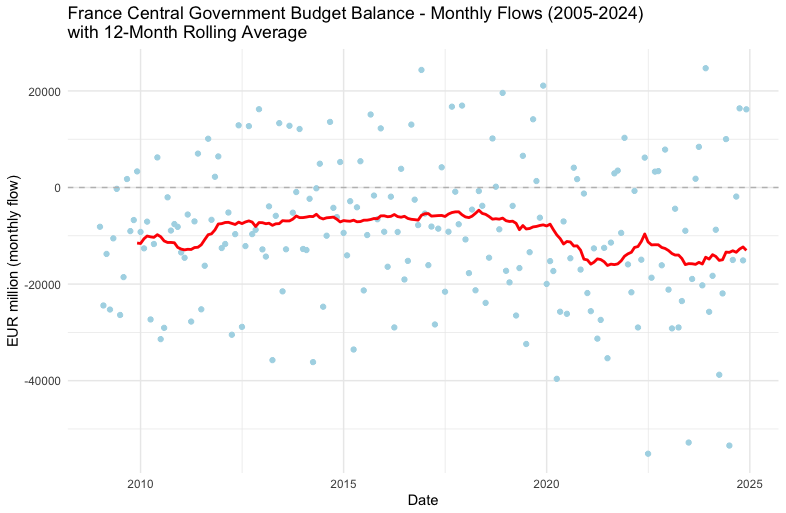
Managed fiscal balance in France, 2005-2024

source : Budgetary directorate (data: 2005-2024, monthly)

France shows little post-COVID dispersion; instead, the balance has recently been exposed to pronounced downside risks.

8. Financial loss distribution across Korean provinces (2014-2023) and seasons (2011-2023) due to natural disasters (March and April 2025)

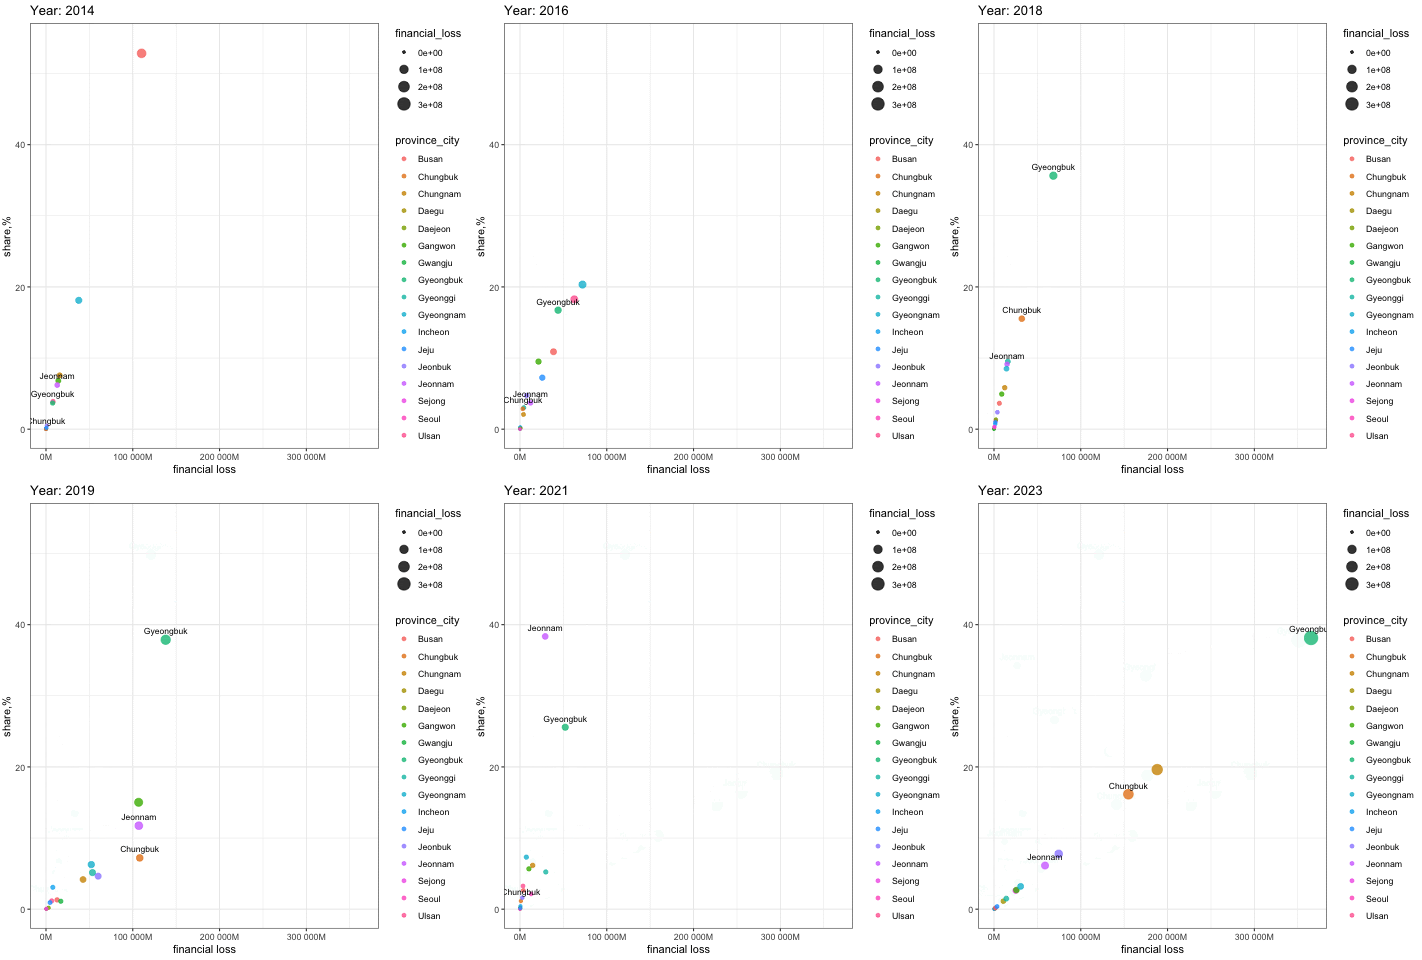
Financial loss distribution across Korean provinces, 2014-2023

source : 재난안전데이터공유프랫폼 (data: 2014-2023, annual) : the analysis chart created by Tnealab (03.2025).

note: financial losses, caused by natural disasters events, are valued at millions of 2023 Korean won.

The plot highlights two key features: the increasing volume of financial losses and the vulnerability of Gyeongbuk province to natural disasters.

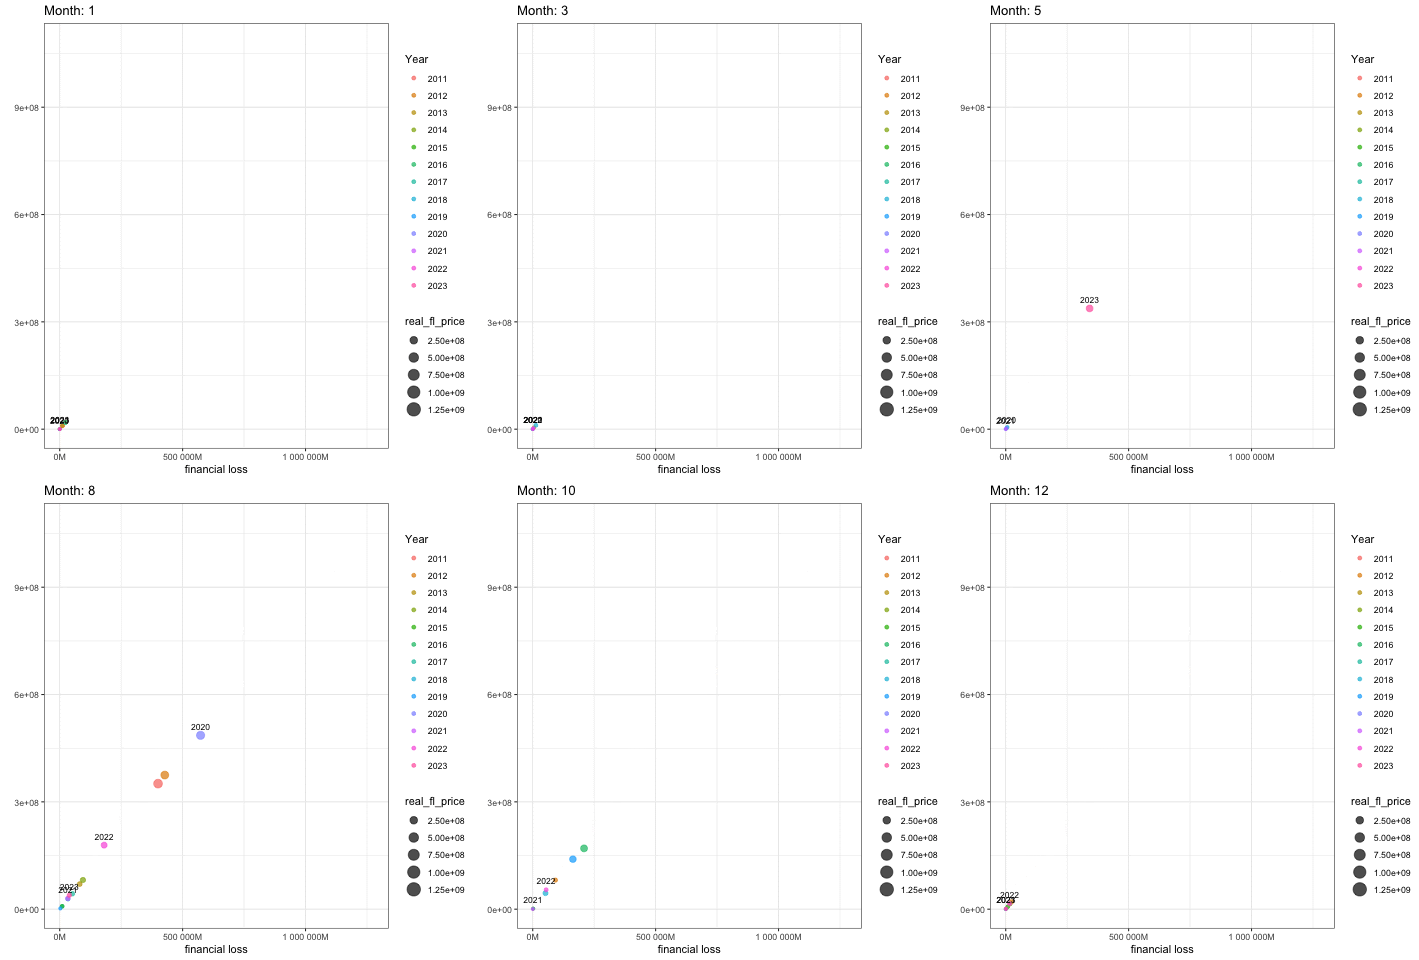
Financial loss distribution across Korean seasons, 2011-2023

source : 재난안전데이터공유프랫폼 (data: 2011-2023, month), BOK (producer price index) : the analysis chart created by Tnealab (04.2025).

note: financial losses, caused by natural disasters events, are valued at millions of 2023 Korean won.

The graph indicates the most concentrated financial damage in the summer, with a recent increase in losses and a shift toward an earlier summer onset.

7. Homeplus, once on the brink of the ECP-run (off-line version), Korea (March 2025)

Homeplus liquidity ratio

source : DART. API (data: 2010-2024, annual) : the analysis chart created by Tnealab (03.2025).

note: The liquidity ratio summarizes the proportion of current assets to current liabilities.

Another form of a bank-run again? Homeplus is narrowly avoiding the crisis but a ratio approaching 20% is a critical warning sign.

6. Summer Rainfall and Debt at Risk (simple exercise), Korea (October 2024)

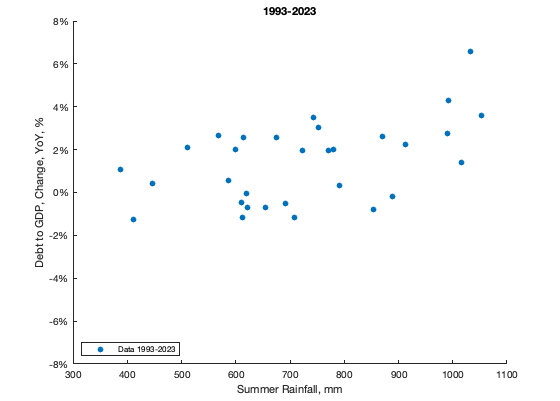
Scatter plot: Debt-to-GDP change vs summer rainfall

Scatter Plot : annual percentage change in Debt-to-GDP ratio and average rainfall (June-August) from 1993 to 2023.

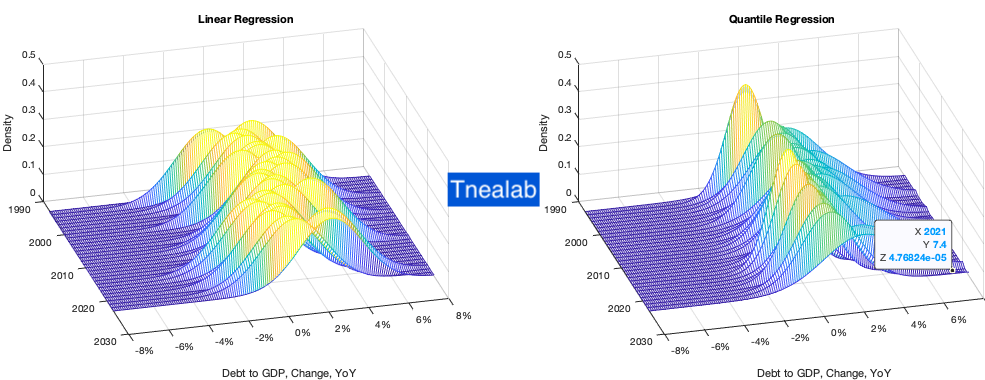
3D density surface: Debt-to-GDP change, 1990-2030, Linear vs Quantile Regression
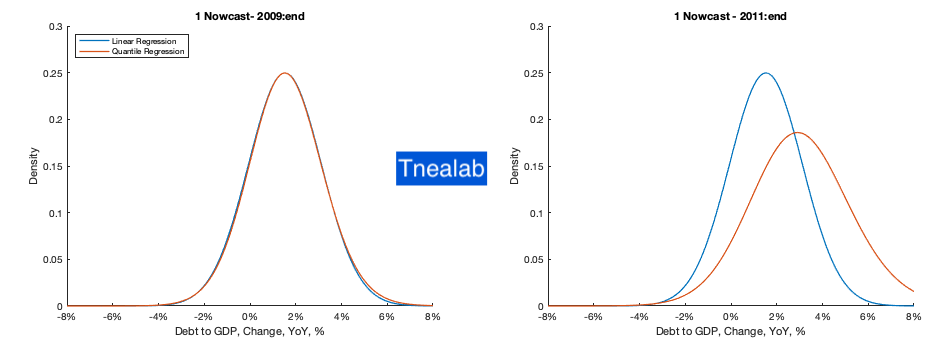
Debt at Risk: 2009 vs 2011 comparison

Debt at Risk : Comparison of 2009 (normal rainfall) vs 2011 (heavy rainfall).

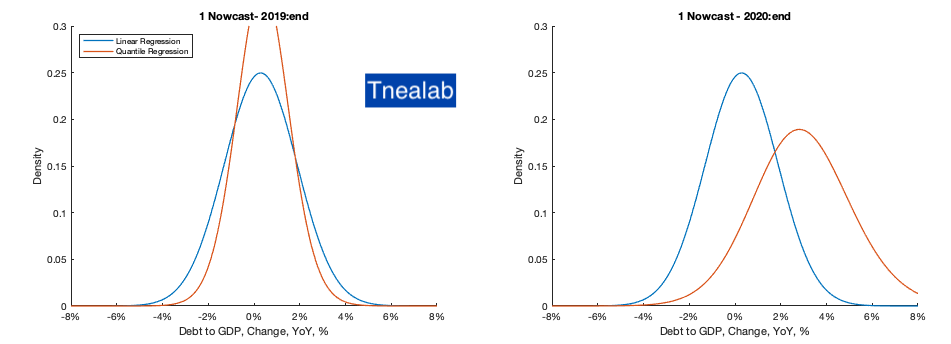
Debt at Risk: 2019 vs 2020 comparison

Debt at Risk : Comparison of 2019 (rainfall below the avg.) vs 2020 (heavy rainfall).

Sources : Debt-to-GDP ratio data from the IMF Fiscal Monitor and rainfall data from the Korea Meteorological Administration

note: Created by Tnealab. Codes from Vulnerable Growth (Adrian, Boyarchenko and Giannone, 2019) and SoFiE.

5. ECP Run...(ECP, E-Commerce-Platform), Korea (July 2024)
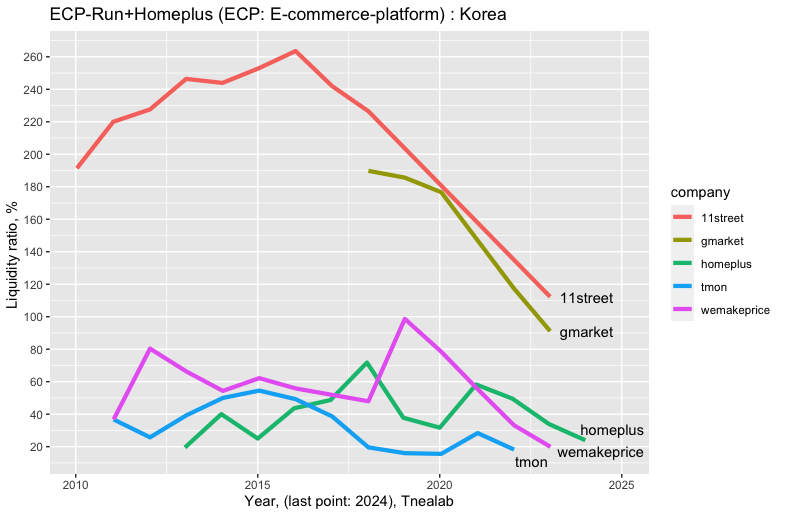
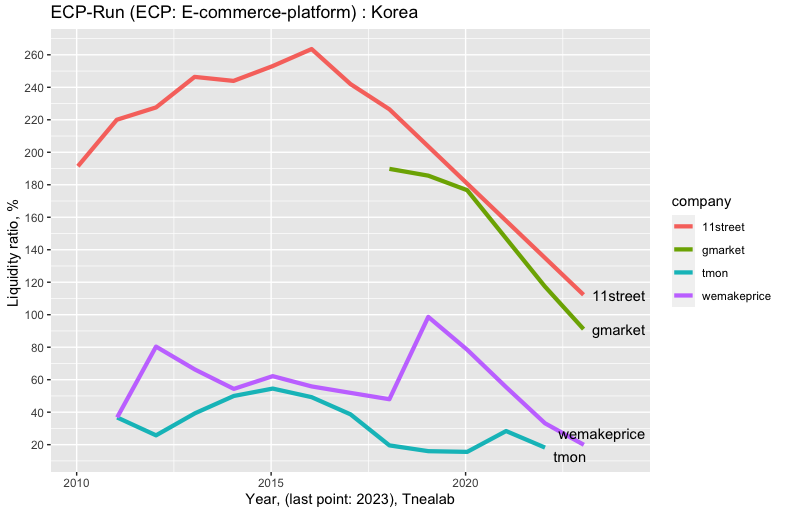
Liquidity ratio of Korean e-commerce platforms, 2010-2023

source : DART. API (data: 2010-2023, annual) : the analysis chart created by Tnealab (07.2024).

note: The liquidity ratio summarizes the proportion of current assets to current liabilities.

Unfortunately, another form of a bank-run. A ratio below 20% was a clear warning and a steep downward trend in the ratios calls for careful monitoring.

Related news : 티몬에 돈 떼일라

4. Sectoral Correlation Analysis : Terms of Trade, Korea (June 2023)
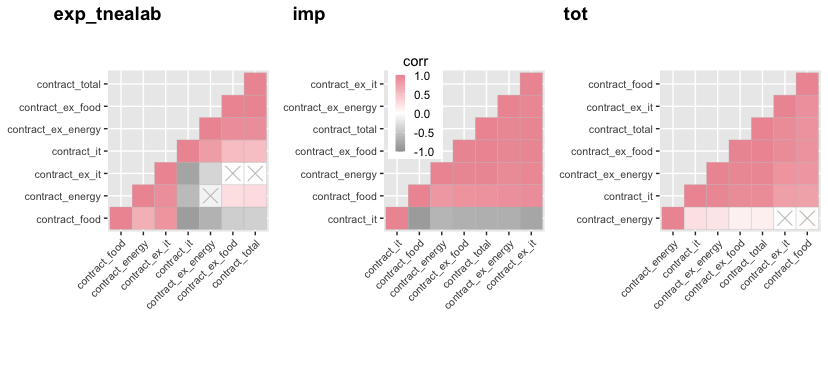
Sectoral correlation matrix: export, import, and terms of trade, by contract currency

source : Bank of Korea (data: Jan 2000–Apr 2023, monthly) : the analysis chart created by Tnealab (06.2023).

note: (1) "contract-" indicates sectoral trade prices based on invoicing currencies. (2) "tot" represents the terms of trade index. (3) "x" with p_value greater than 0.05.

3. Sentiment Analysis : Hamlet and the FOMC (February 2023)
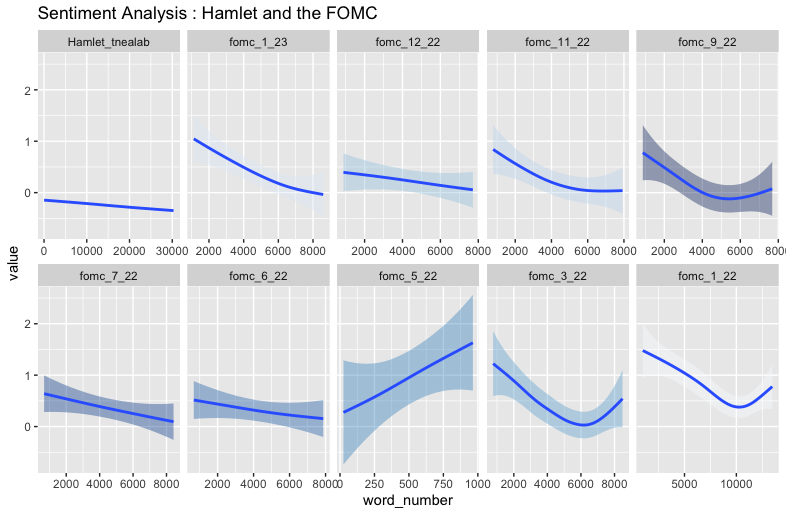
Sentiment analysis: Hamlet and FOMC minutes, by meeting

source : Hamlet (gutenberg), Minutes of the FOMC (federalreserve.org), created by Tnealab (02.2023).

2. Global Risk Scenario (2019) and Uncertainty Index (2022) (December 2022)
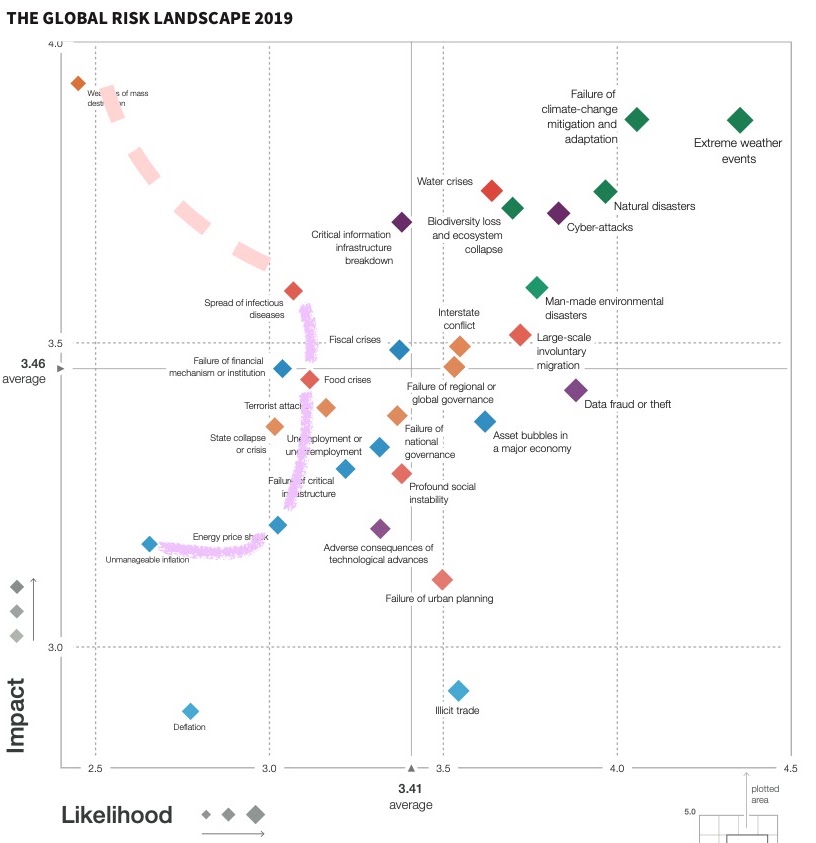
The Global Risk Landscape 2019

source: WEF Global Risks Report 2019

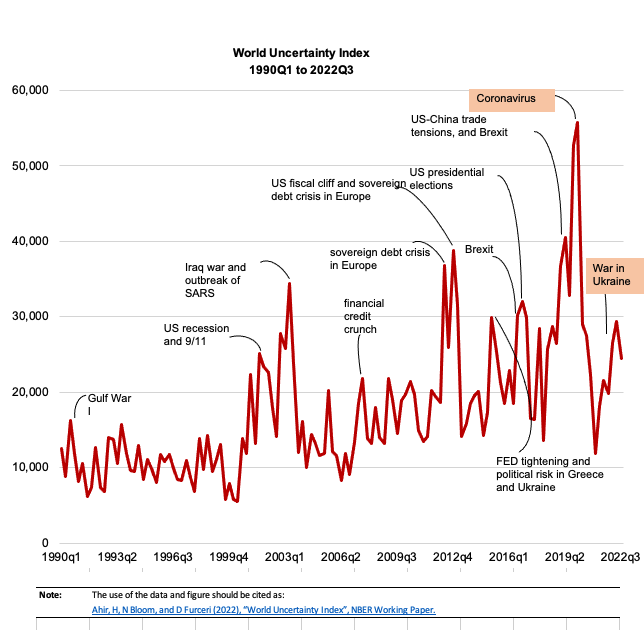
"According to the map (left, 2019), low-probability risks materialized last couple of years amid extreme weather events. ... ... ..."

World Uncertainty Index, 1990Q1 to 2022Q3

source: Ahir, H, N Bloom, and D Furceri (2022), "World Uncertainty Index", NBER Working Paper.

1. Long-Term Investment Flows (July 2022)
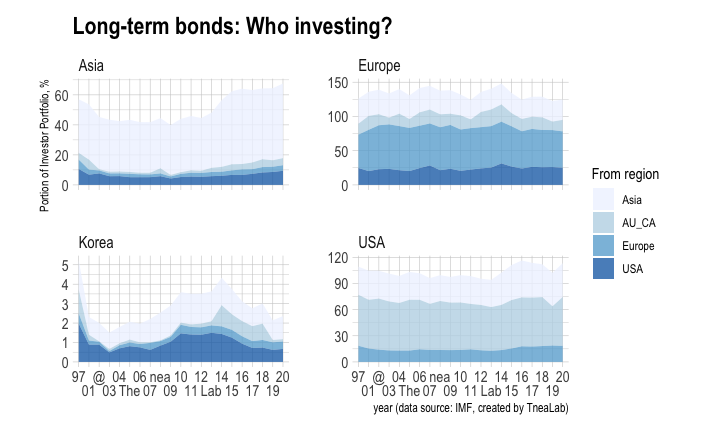
Long-term bonds: who is investing, by region (Asia, Europe, Korea, USA)

source : IMF, created by Tnealab.

"A rough picture of investors' asset allocation across regions (from region to region)."