Applied AI Issues
11. RAG : Stablecoins in Seconds (Sep., 2026)
Version 2.0 in progress, following the first demo release.
created by sujin.kim (Tnealab) (09.2026).
Applied AI Issues
Version 2.0 in progress, following the first demo release.
created by sujin.kim (Tnealab) (09.2026).
Fintech Issues
Where is Korea heading?
| Status | Purpose | Cases |
|---|---|---|
| Final approval | Issuer | Circle (USDC) |
| Conditional approval | Issuer | World Liberty (USD1), Sony / Connectia 🇯🇵, Ripple (RLUSD), Paxos (USDP / PYUSD) |
| Issuance-as-a-service* | Bridge (Stripe) — currently powers Phantom’s CASH and MetaMask’s mUSD via Stripe’s “Open Issuance” platform | |
| Custodian | BitGo, Fidelity Digital Assets, Coinbase, Foris DAX / Crypto.com 🇲🇹 🇸🇬, Protego, Laser Digital / Nomura 🇯🇵 | |
| Rejected | Issuer | Wise 🇬🇧 — rejected over AML/BSA concerns |
| Pending (trust charter) | Issuer | Dakota, Agora / AUSD 🇧🇲, PAYO (Payoneer, PAYO-USD) |
| Issuance-as-a-service* | Bastion, Catena Labs (for AI agents) | |
| Custodian | Kraken (Payward), EDX Markets, Lorum 🇦🇪 | |
| Pending (other track) | Unclear | Revolut 🇬🇧 (new full-service bank application), CBW (state-to-national conversion) |
| Issuer (hybrid) | OpenReserve — insured full-service bank application that also names a ReserveUSD issuance subsidiary | |
| Pending | Unknown | First National Bank of Cooper — under acquisition (Ark Financial Holding), likely tied to a digital-banking expansion filing |
* Issues stablecoins on behalf of third parties who market them under their own brand, running the reserve management and minting infrastructure behind the scenes.
source : OCC (Office of the Comptroller of the Currency), created by Tnealab.
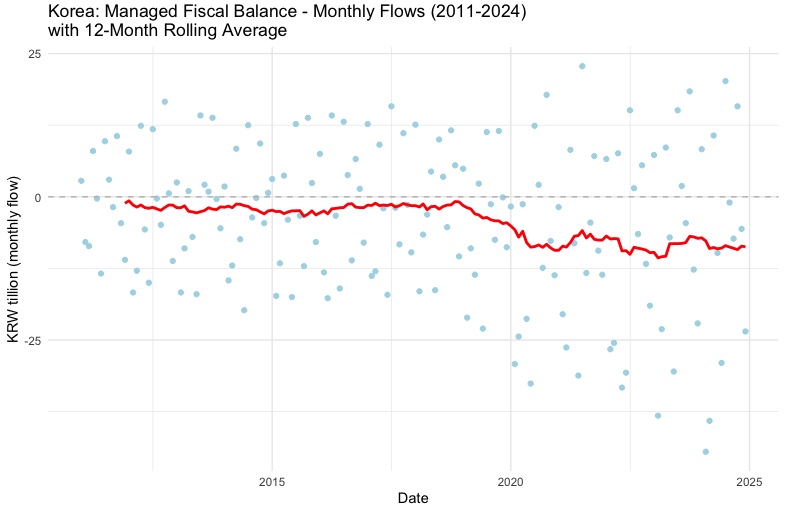
source : 열린재정 (data: 2011-2024, monthly)
The managed fiscal balance experienced increased dispersion following COVID-19 and has remained tilted to the downside until recently.
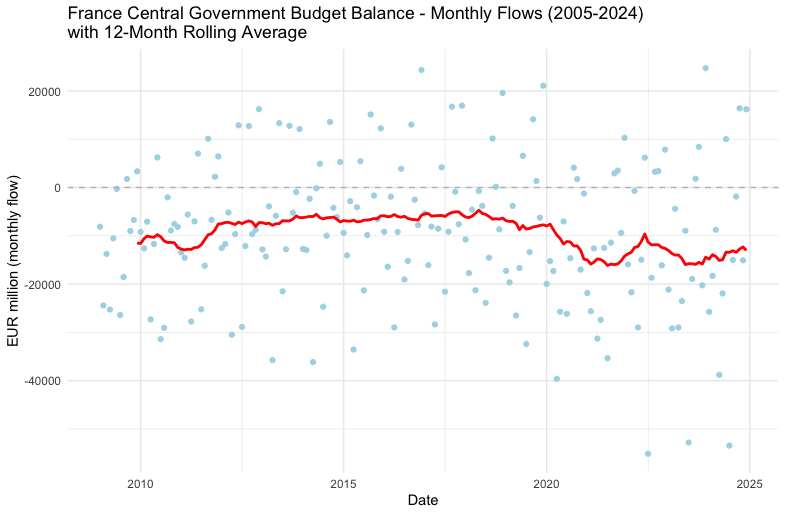
source : Budgetary directorate (data: 2005-2024, monthly)
France shows little post-COVID dispersion; instead, the balance has recently been exposed to pronounced downside risks.
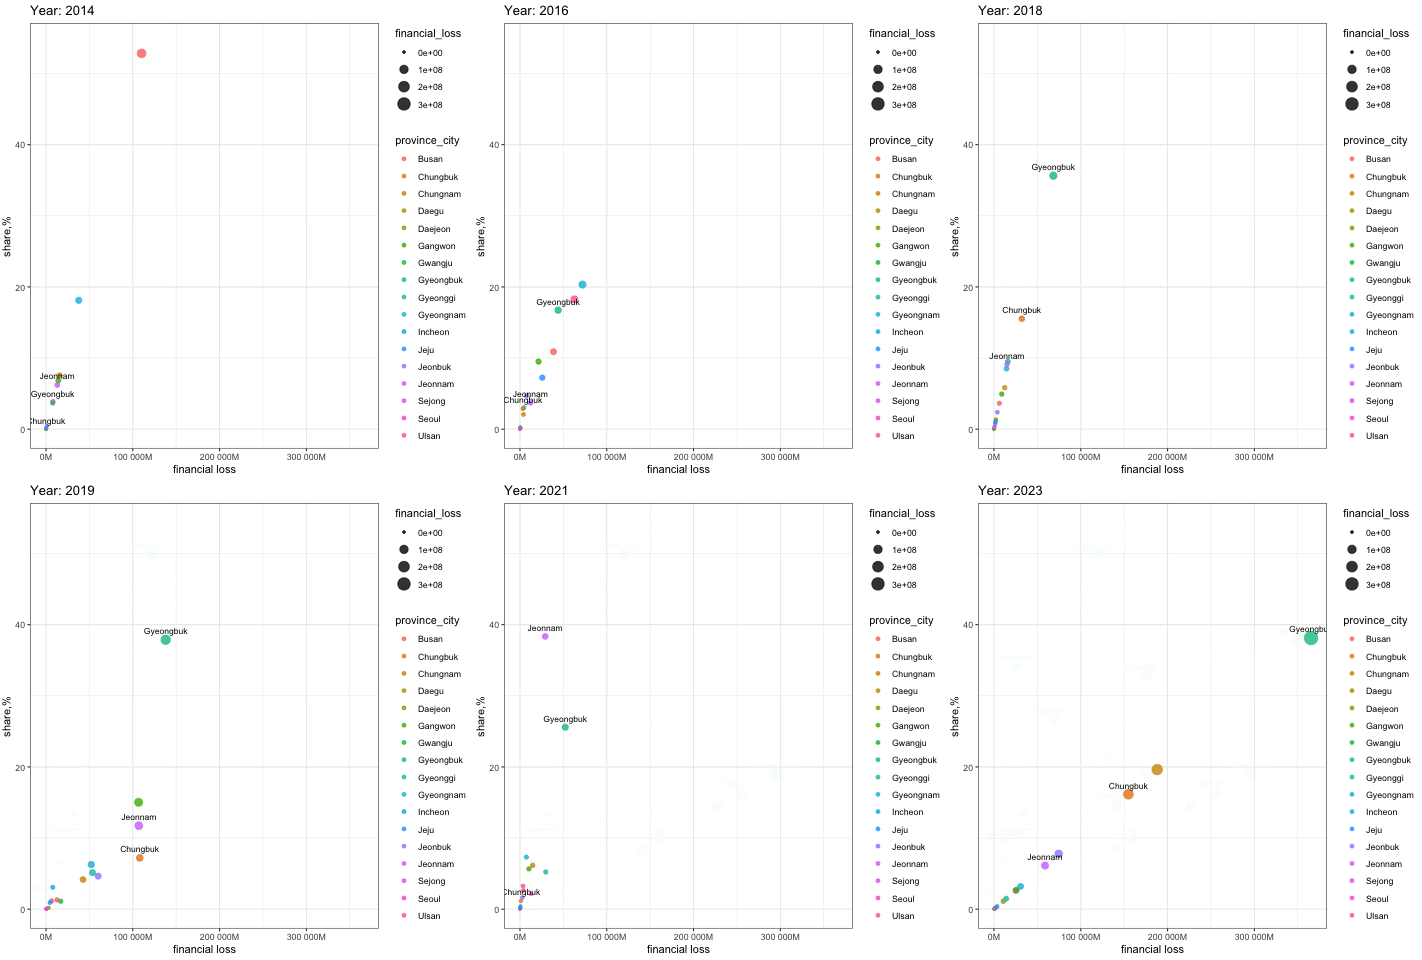
source : 재난안전데이터공유프랫폼 (data: 2014-2023, annual) : the analysis chart created by Tnealab (03.2025).
note: financial losses, caused by natural disasters events, are valued at millions of 2023 Korean won.
The plot highlights two key features: the increasing volume of financial losses and the vulnerability of Gyeongbuk province to natural disasters.
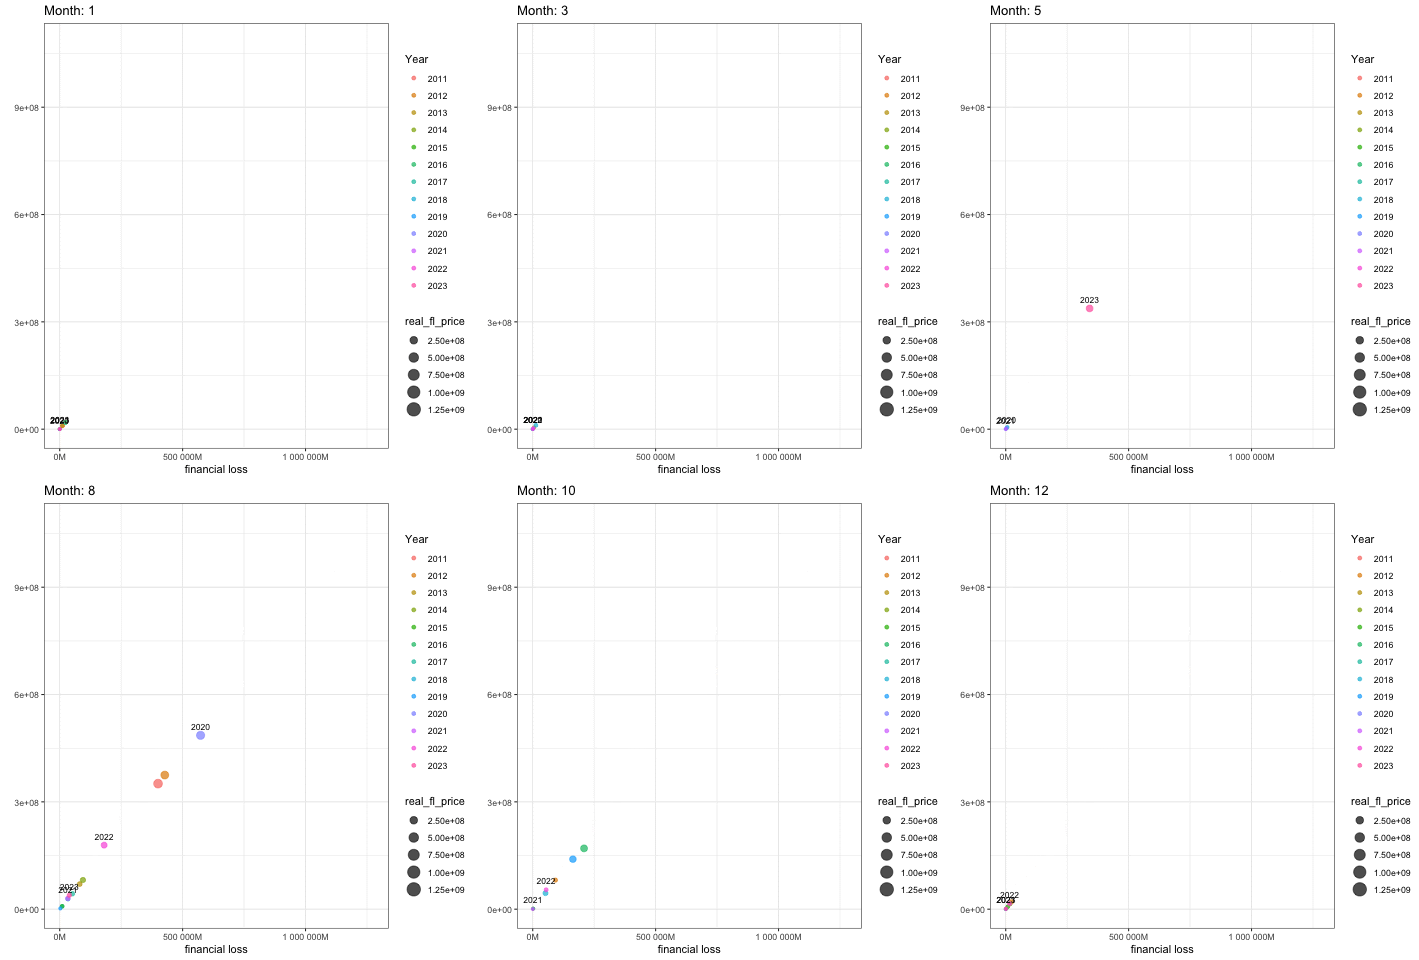
source : 재난안전데이터공유프랫폼 (data: 2011-2023, month), BOK (producer price index) : the analysis chart created by Tnealab (04.2025).
note: financial losses, caused by natural disasters events, are valued at millions of 2023 Korean won.
The graph indicates the most concentrated financial damage in the summer, with a recent increase in losses and a shift toward an earlier summer onset.
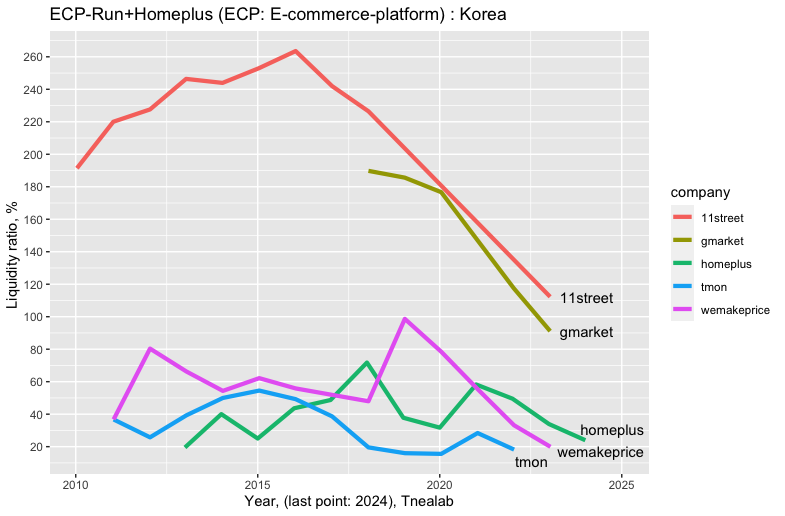
source : DART. API (data: 2010-2024, annual) : the analysis chart created by Tnealab (03.2025).
note: The liquidity ratio summarizes the proportion of current assets to current liabilities.
Another form of a bank-run again? Homeplus is narrowly avoiding the crisis but a ratio approaching 20% is a critical warning sign.
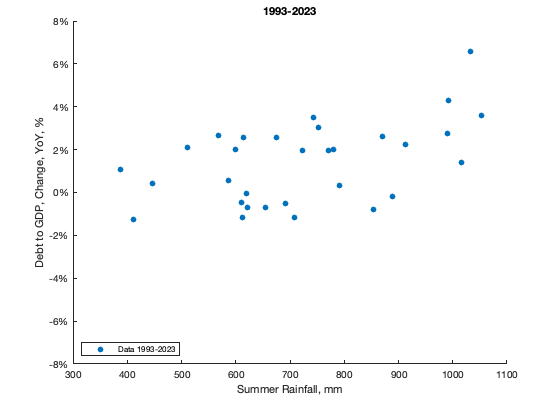
Scatter Plot : annual percentage change in Debt-to-GDP ratio and average rainfall (June-August) from 1993 to 2023.
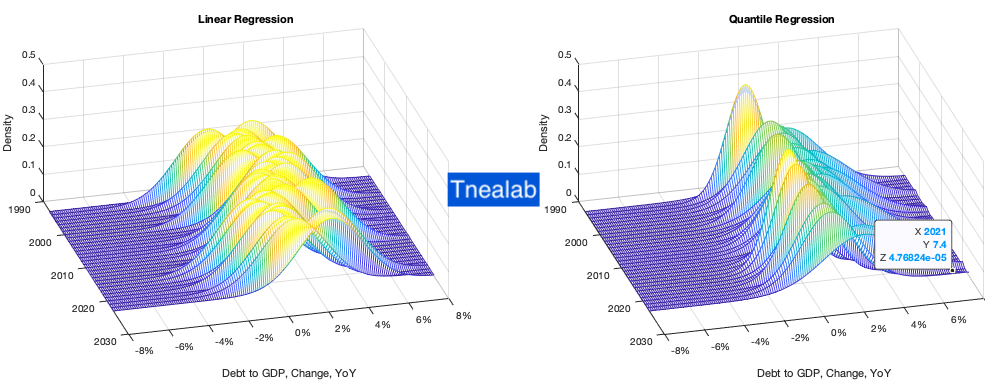
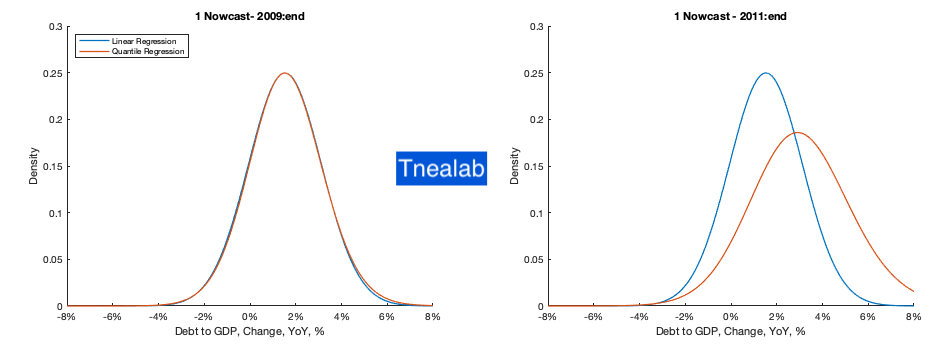
Debt at Risk : Comparison of 2009 (normal rainfall) vs 2011 (heavy rainfall).
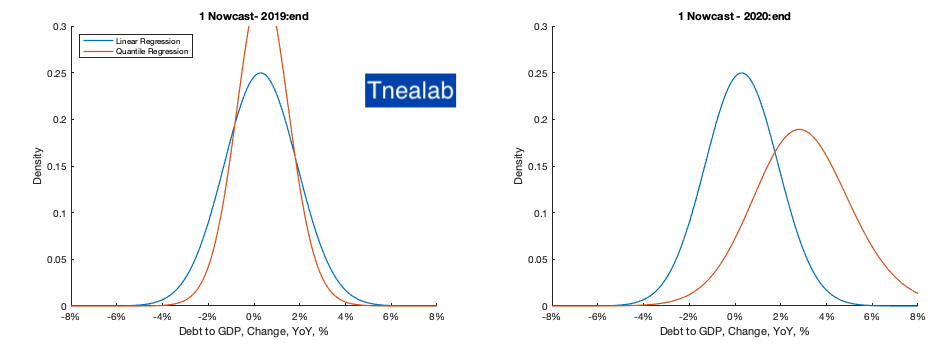
Debt at Risk : Comparison of 2019 (rainfall below the avg.) vs 2020 (heavy rainfall).
Sources : Debt-to-GDP ratio data from the IMF Fiscal Monitor and rainfall data from the Korea Meteorological Administration
note: Created by Tnealab. Codes from Vulnerable Growth (Adrian, Boyarchenko and Giannone, 2019) and SoFiE.
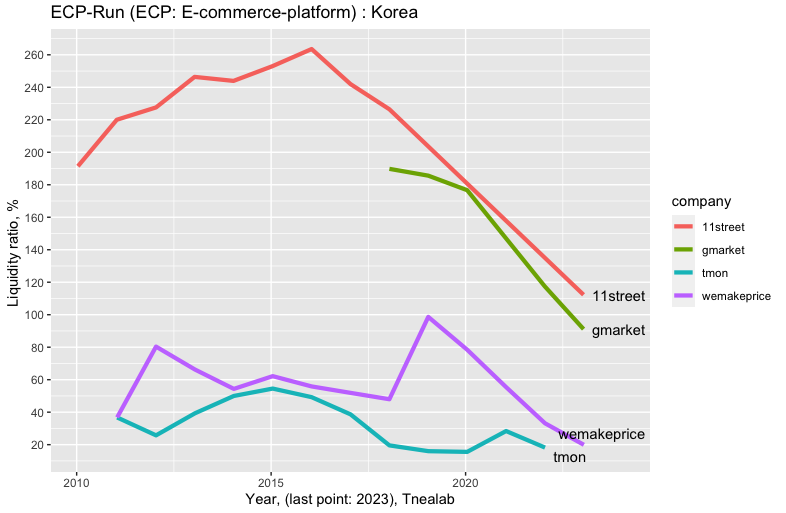
source : DART. API (data: 2010-2023, annual) : the analysis chart created by Tnealab (07.2024).
note: The liquidity ratio summarizes the proportion of current assets to current liabilities.
Unfortunately, another form of a bank-run. A ratio below 20% was a clear warning and a steep downward trend in the ratios calls for careful monitoring.
Related news : 티몬에 돈 떼일라
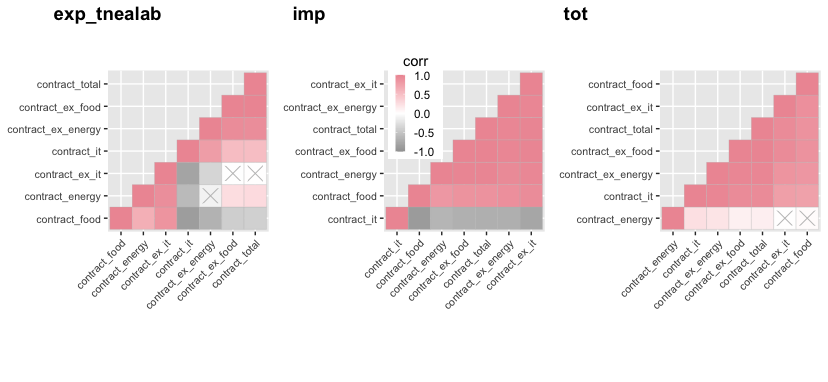
source : Bank of Korea (data: Jan 2000–Apr 2023, monthly) : the analysis chart created by Tnealab (06.2023).
note: (1) "contract-" indicates sectoral trade prices based on invoicing currencies. (2) "tot" represents the terms of trade index. (3) "x" with p_value greater than 0.05.
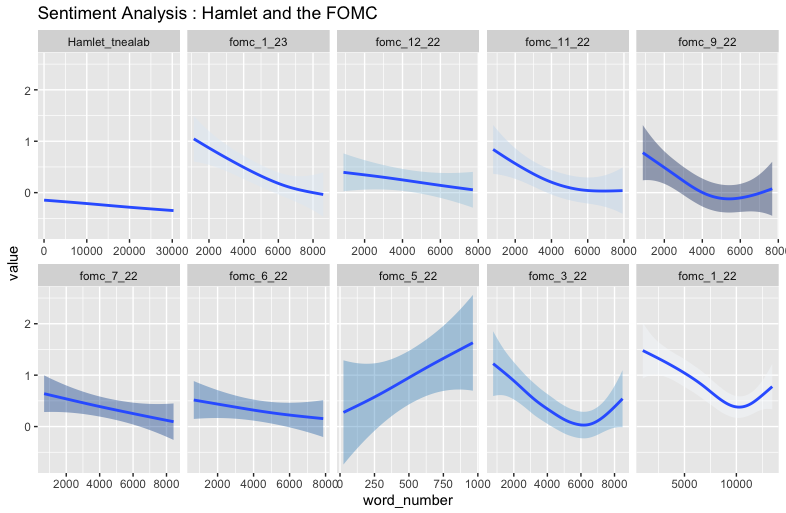
source : Hamlet (gutenberg), Minutes of the FOMC (federalreserve.org), created by Tnealab (02.2023).
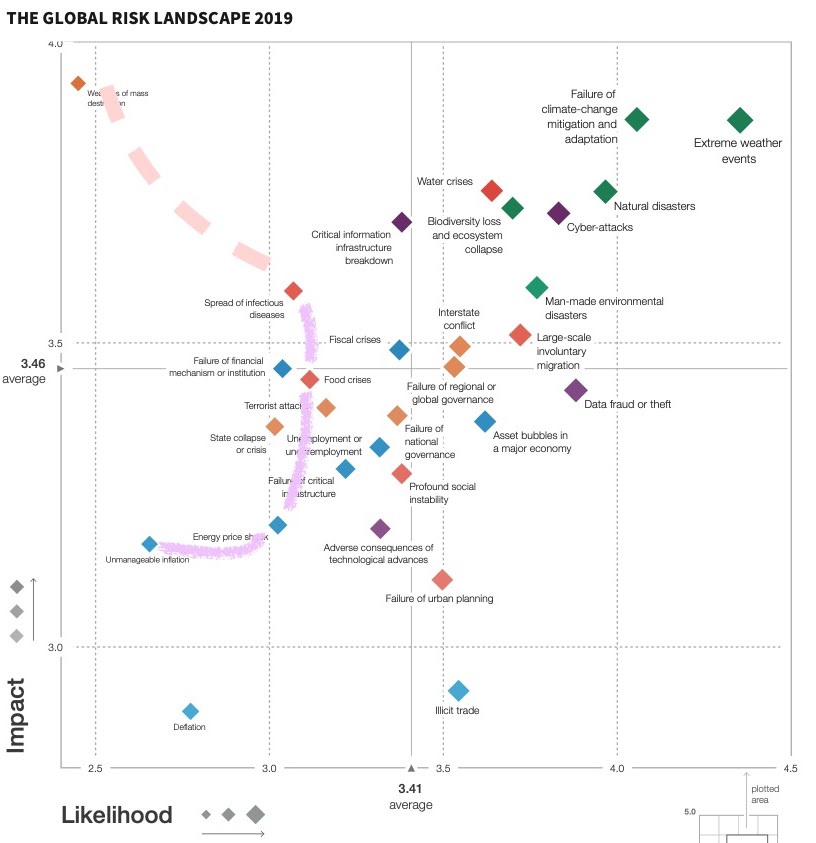
source: WEF Global Risks Report 2019
"According to the map (left, 2019), low-probability risks materialized last couple of years amid extreme weather events. ... ... ..."
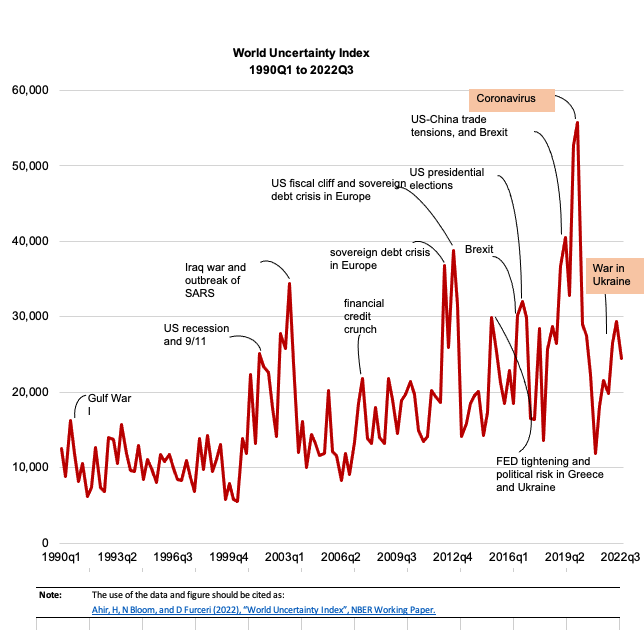
source: Ahir, H, N Bloom, and D Furceri (2022), "World Uncertainty Index", NBER Working Paper.
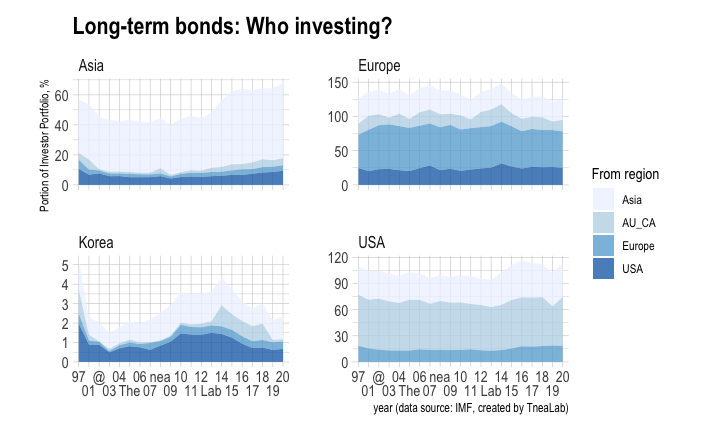
source : IMF, created by Tnealab.
"A rough picture of investors' asset allocation across regions (from region to region)."